Tracking the Sales of Raw Materials
Use Material Manager to track the sales of raw materials over time and forecast restocking
Introduction
Tracking the sales of raw materials is crucial for a Shopify store because it enables efficient inventory management and accurate forecasting. By monitoring the usage and sales of raw materials, store owners can predict when to restock, ensuring that they always have the necessary materials on hand to meet customer demand. This helps in avoiding stockouts that can lead to lost sales and dissatisfied customers. Additionally, tracking raw materials can identify trends and patterns in sales, allowing for better planning and optimization of the supply chain.
Material Manager allows you to easily track the sales of raw materials over time. The app provides detailed reports and insights into the usage of each material, helping you make informed decisions about restocking and inventory management. By leveraging this data, you can optimize your production process, reduce waste, and improve overall efficiency.
Sales data view
To access the sales data on the Material Manager dashboard, click on the “Sales data” tab. This will add columns to the table that display sales of raw materials over time as well as sales and restock forecasts.
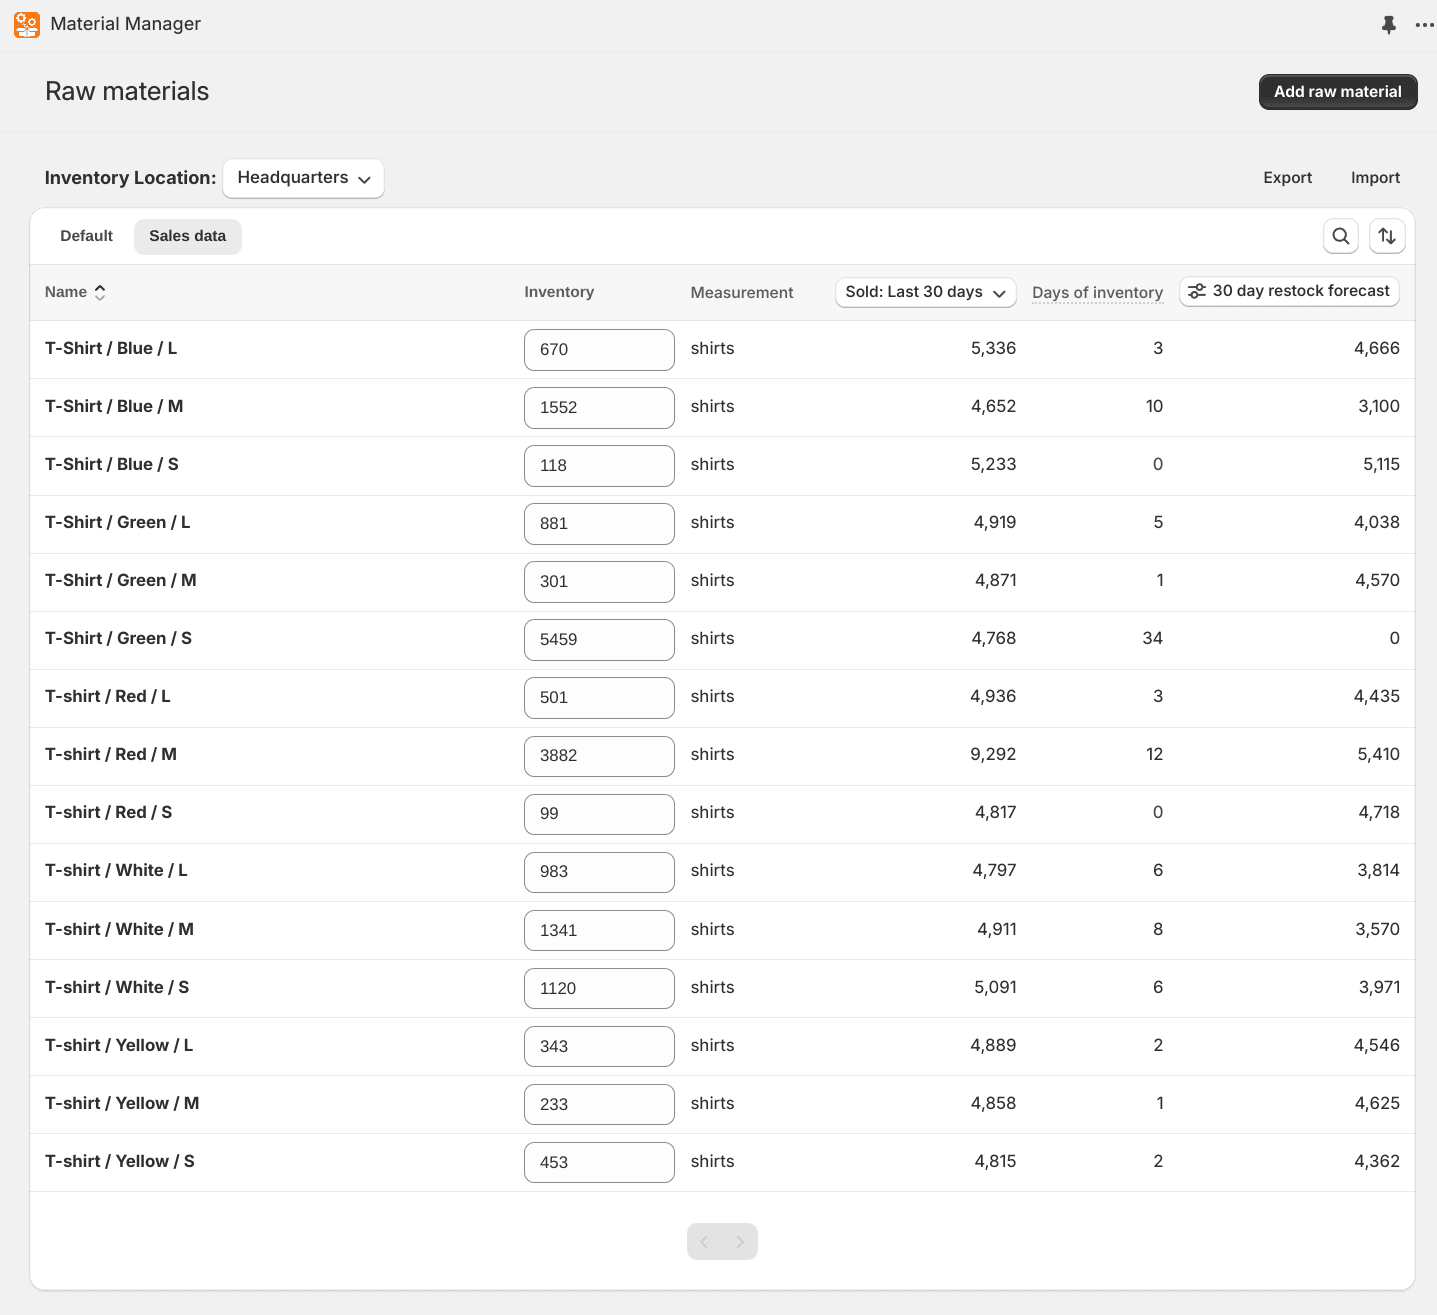
Sales data columns
This view has 3 extra columns related to sales and inventory forecast:
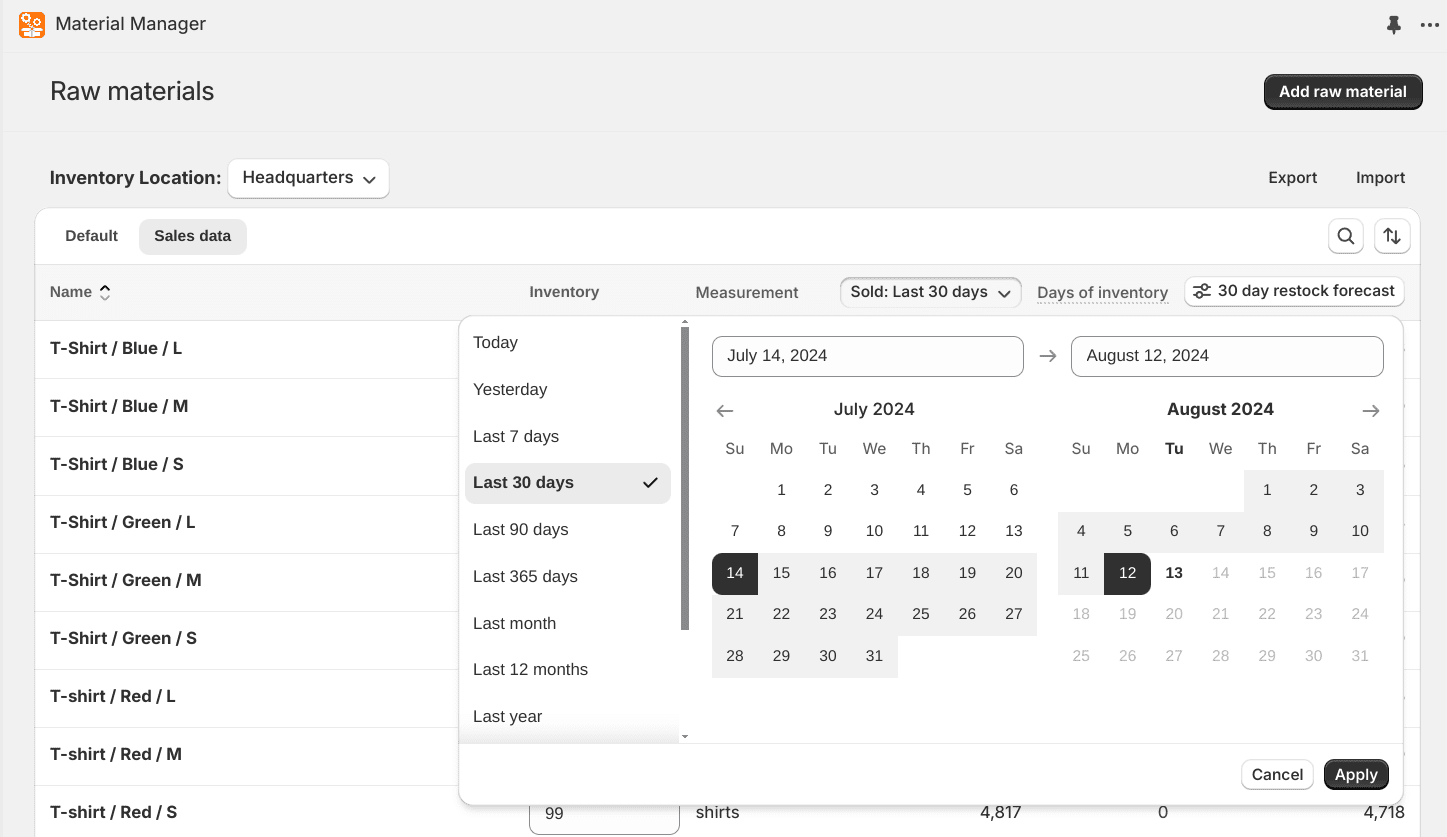
- Sold count: The total number of sales of this raw material over a period of time. The default is sales over the last 30 days. The date range can be changed by clicking on the column header.
- Days of inventory: The estimated number of days before the inventory of the raw material is depleted. This is calculated using the average sales per day of the selected date range in the sold column.
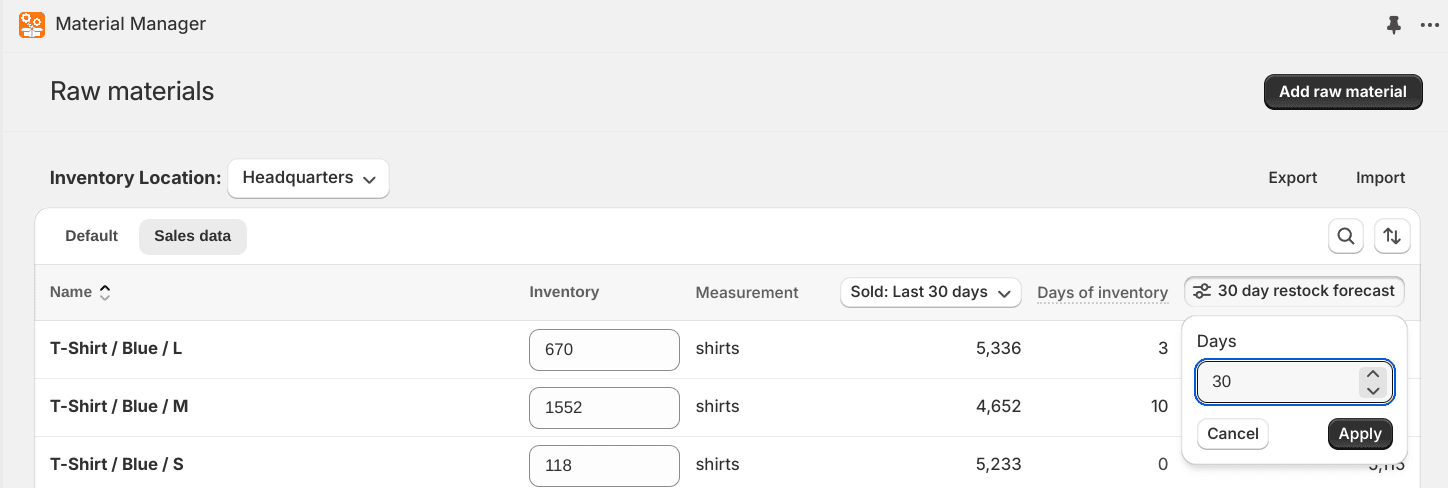
- Restock forecast: The estimated number of units that need to be restocked to have enough inventory for the selected number of days. This is calculated using the average sales per day of the selected date range in the sold column minus the current inventory. The number of days can be changed by clicking on the column header.
Exporting the sales data
When viewing the sales data tab, clicking on the “Export” button will include the sales data in the downloaded CSV file. It will use the current date range from the sold column and number of days in the restock forecast column.
Graph of sales data
When viewing a material, there is a simple graph of the sales trends for that material over time. The date range can be modified to update the graph and sales count.
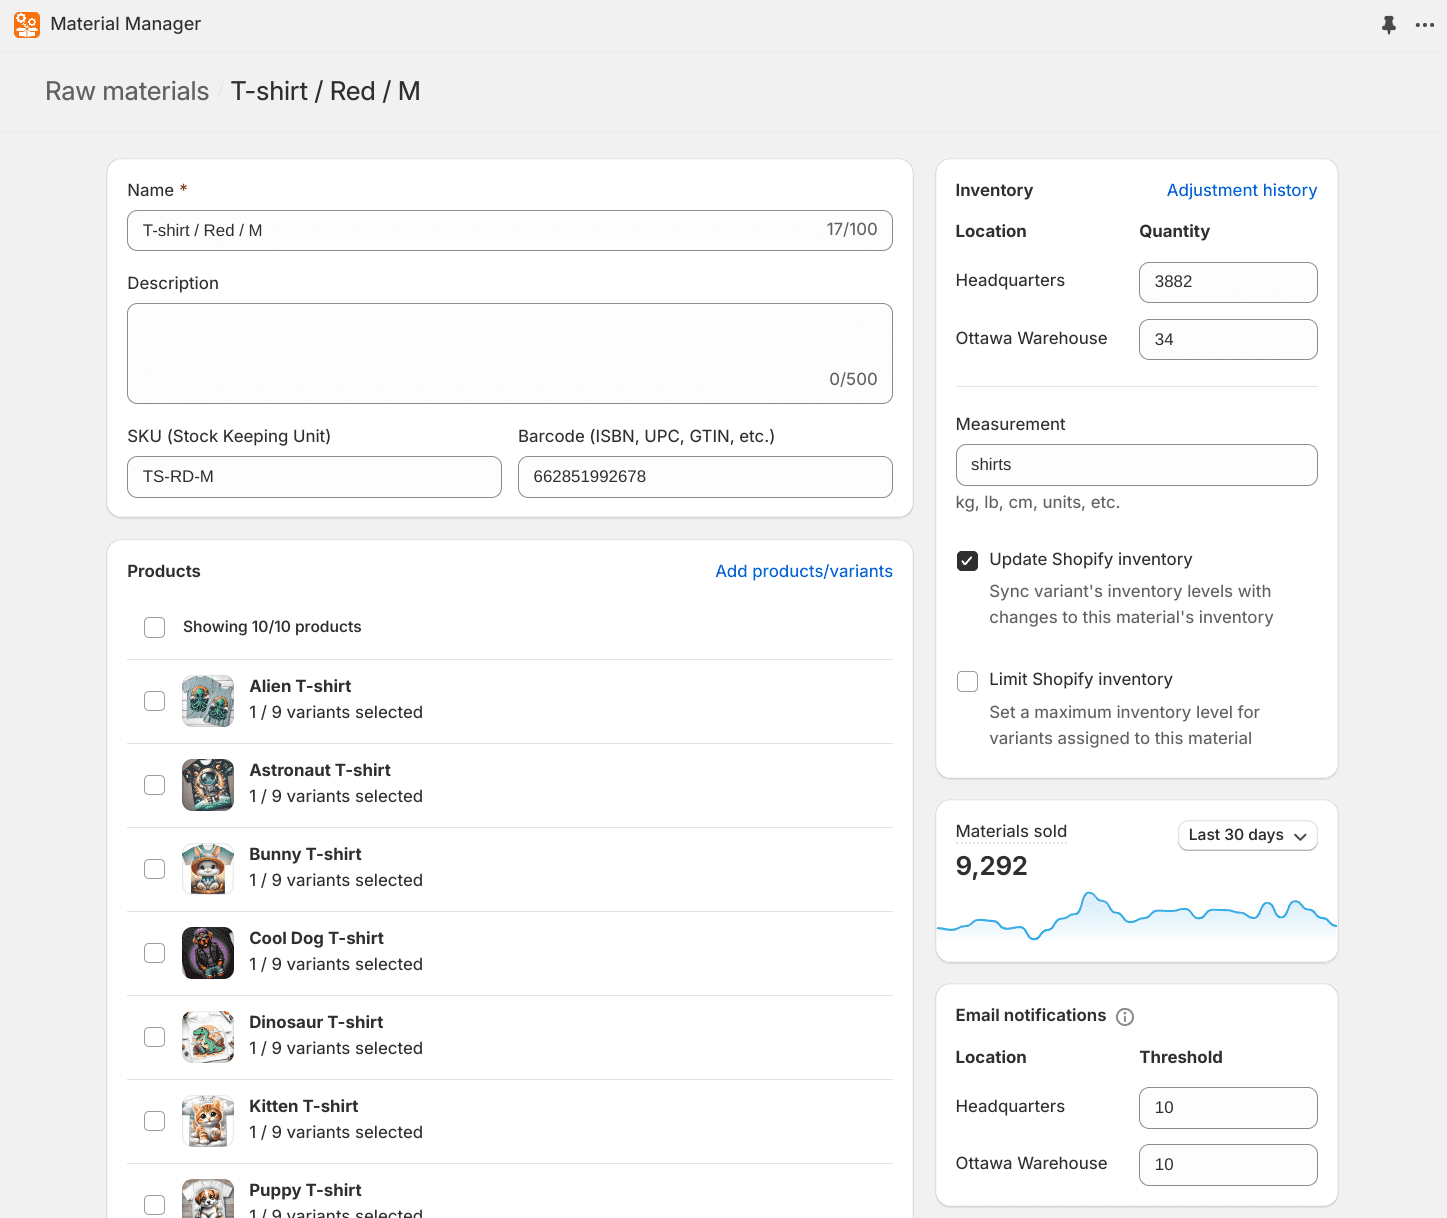
Low stock email notifications
On the page for a raw material, you can set a threshold to be notified by email when the inventory falls below a certain level. This can be set for each of your store’s locations.
Clicking on the “Notifications” link in the left navigation will bring you to a page where you can see all users who have notifications set up. You can also cancel all notifications for a specific user here.